Week 2 Case Study: Neural Networks and Reading by Machine
All of this material is also available on Google Docs (MSU login required)
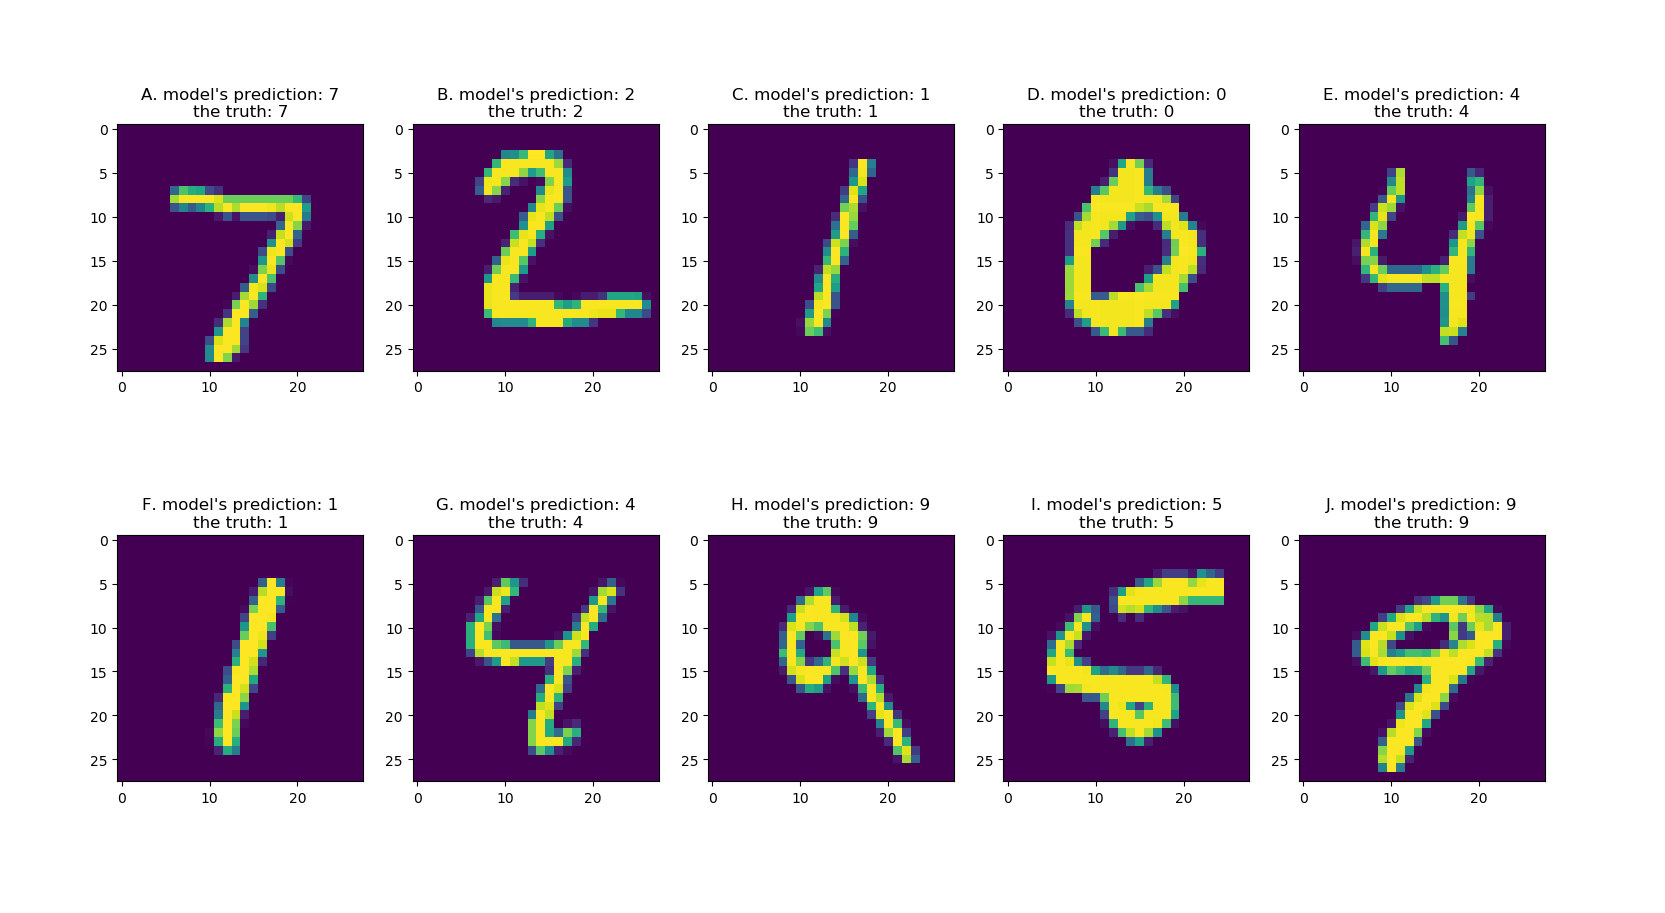
Image Recognition in Postal Systems and Policing#
Two systems that look at pixels and decide what they are: the U.S. Postal Service reads handwritten ZIP codes to ensure mail gets where it’s going, and police departments use facial recognition to identify suspects.
These two use cases are close cousins. Both take an image, break it into a grid of numbers, and pass those numbers through neural networks until a label comes out the other end. The mathematics that these two systems use is nearly the same. The neural network that reads your grandparents’s handwriting on an envelope is a direct ancestor of the one that scans a security camera still.
What differs is what happens when they identify what is in the image incorrectly. When the US mail system fails, an envelope goes to a room in Salt Lake City where a person looks at a photo of it and types the address. The letter might arrive late, but it gets there eventually. When facial recognition fails, Robert Williams gets arrested on his front lawn in Farmington Hills in front of his wife and two daughters for a theft he had nothing to do with.
This week we focus on Tools. This lesson is not that neural networks are good or bad, but that every tool has a failure profile. There is a rate of failure, a pattern of who it fails, and a cost borne by someone. Two systems can share an architecture and have completely different failure profiles.
Prep reading & resources (Complete by Wed, Sep 9)#
You do not individually have to review all materials. We expect that you will spend at least 90 minutes with these materials. Groups can discuss how to ensure all posted materials are reviewed each week.
How the tool works#
- 📺 But what is a neural network? (3Blue1Brown via YouTube, Chapter 1) — the single most important tool in AI and machine learning. Grant Sanderson builds a network that reads handwritten digits off a 28×28 grid of pixels, which is exactly what we will do by hand in class. Watch for the idea that each neuron holds a number between 0 and 1, and that a “feature” like a loop or an edge is just a pattern of these numbers (called “weights”) (19 min).
- 📺 Gradient descent, how neural networks learn (3Blue1Brown via YouTube, Chapter 2) — where the numbers come from. Nobody hand-writes the weights; the network adjusts them by measuring how wrong it is and taking a small step downhill, millions of times. Don’t panic at the notation. If you follow the idea of a cost that gets minimized by many tiny corrections, you have what you need (21 min).
Reading the mail#
- 📖 Postal Service tests handwriting recognition system (Government Executive, 1999) — this is the historical baseline. When it launched, the handwriting system was right 30 to 40% of the time and that was considered a triumph. Why is recognizing handwriting hard? It is not sloppiness. People write all over the envelope and machines struggled to segment the address into parts.
- 📺 How the US Postal Service reads terrible handwriting (Tom Scott, 2022) — Scott visits the Remote Encoding Center in Salt Lake City, the last one in the country, and sits down at a keyer’s station to try the job himself. This facility handles roughly 1.2 billion mail images a year — about 38 every second — and it exists only to process the envelopes the machines gave up on (7 min).
- 📖 Systems at Work (Smithsonian National Postal Museum) — the step-by-step of what happens to a letter. The Advanced Facer-Canceller photographs envelopes as they fly past, then software finds the stamp, locates the address block, reads the handwriting, and checks it against a database of known addresses. Note that last step: the system isn’t recognizing letters in a vacuum, it’s matching against a list of addresses that actually exist. That constraint is doing enormous work. There is also video called 📺 All Systems at Work embedded in this site (9 min).
Reading faces#
- 📖 Gender Shades: Project Overview (Buolamwini & Gebru, MIT Media Lab) — Joy Buolamwini started this after running her own conference headshot through commercial face software. The core finding: existing benchmark datasets were 79.6% and 86.2% lighter-skinned, so companies were measuring accuracy against a population that wasn’t the world. Her phrase for it is “pale male data.” There is a video called 📺 Gender Shades (5 min) as well as a 🎧 Ted Radio Interview with Joy Buolamwini (9 min) embedded in this site.
- 📖 Study finds gender and skin-type bias in commercial AI systems (MIT News, 2018) — the numbers behind the project. Error rates for lighter-skinned men never exceeded 0.8%. For darker-skinned women they ran to 34.7%, and for the darkest-skinned women in the set, 46.5% and 46.8%. As Buolamwini puts it, the system might as well have been guessing. Also note the company that advertised 97% accuracy on a test set that was 77% male and 83% white.
- 📖 Facial Recognition (ACLU of Michigan) — this one happened here. In 2020 Detroit police arrested Robert Williams on his front lawn based almost entirely on a facial recognition scan of Shinola store footage. There is a 📺 short video documentary (8 min) embedded in this site. He wasn’t the man in the video and wasn’t near the store. There are 📖 three known wrongful arrests from Detroit police facial recognition; all three people were Black. One, 📖 Porcha Woodruff, was eight months pregnant when six officers came to her home.
- 📖 Civil Rights Advocates Achieve the Nation’s Strongest Police Department Policy on Facial Recognition (ACLU of Michigan, June 2024) — what changed. Detroit police can no longer arrest someone on facial recognition results alone, or run a photo lineup straight off a facial recognition search, and every case since 2017 where the technology produced an arrest warrant gets reviewed. Law students at U-M worked this case for four years. Policy is a thing people build, slowly.
The complication
- 📖 Actionable Auditing (Raji & Buolamwini, 2019) — read this before you conclude the story is simple. After Gender Shades was published, the named companies went back and fixed their systems, and the error gaps for darker-skinned women narrowed substantially. Public auditing worked. So: is the problem the tool, the training data, the absence of testing, or the absence of anyone required to test? Your group has to take a position.
Optional and longer: the documentary Coded Bias (2020) follows Buolamwini’s work and is often available online.
Wednesday: We Build a Network Out of People#
You are the network. We will not use computers. Stay in your group for the whole session.
Round 1 — one layer, in your groups (~15 min)#
Each group will receive a set of printed shapes — circle, square, rectangle, or triangle — that have been rendered on a coarse grid. Each person in your group (except one) selects one or more cells and can report exactly one thing about their cell: is it filled or empty. You are the input neurons. One group member, who acts as the output neuron, turns away from the others and cannot see the grid. Output neurons will receive a blank grid for notetaking or sketching.
Input neurons choose the image they want to start with; output neuron can’t see the selected image.
Input neurons may not say “it looks like a triangle.” You can only report on your selected cells. That’s all the information that you have. Output neurons can ask questions about cells and can make notes or sketches in the blank grid paper they were given. After asking enough questions about the cell, the output neuron announces the shape.
After the first run try a few things:
- Run it with different shapes. Are some easier to identify than others?
- Try different forms of basic reporting. Assign rows or columns, or areas of the image. Does this make things more efficient?
- Report the rough fraction of the filled in grid instead of filled or not. Does this make things easier?
We just want you to run it more times with different shapes (and you can change the person acting as the output neuron). You all can discuss how your input neurons can change what they describe in either a given cell or assigning a set of cells. How much better does the output neuron get at determining shapes?
Group Discussion — why is determining handwritten digits are harder (~10 min)#
You might want to take notes on this discussion in your Case Study template!
Shapes have defining features you can name in one word: four equal sides, three corners, a closed curve with no corners at all. That’s likely why filled/empty cells were enough — the output neuron could reconstruct the answer almost by counting.
Digits don’t reduce that cleanly. Look at the set of digits you have with a grid overlaid on them. Notice a 4 and a 9 both have a closed loop. A 7 and a 1 differ by one stroke. Talk through it as a group:
- What would you need to know, beyond filled/empty, to tell digits apart?
- Who would “compute” that — is it still the output neuron, or does someone need to pre-digest the raw cells first?
That pre-digesting job is what a hidden layer does: a layer of neurons that each answer one narrow question about the cells (horizontal bar across the top? closed loop?) and pass forward a single number, not the raw cells.
Try to write as many questions as your group could ask as a hidden layer to identify handwritten digits.
Round 2 — the questions we can’t write (~15 min)#
You might want to take notes on this discussion in your Case Study template!
You just described, in words, what a hidden layer would need to do for digits. The questions could be written because we already know what digits are made of: ten symbols, drawn with a few strokes, and we agree on what they look like. That is, as humans who have worked with numbers for years, we know what a 3 looks like.
Now lets try to do the same job for faces. Here’s a photo of Elmo as a cosmic being.

Your grid shows Elmo on a grid of coarse pixels. We show them in color and using typical color bands (red, green, blue) below. The intensity of each pixel (using grayscale, 0-255) is shown below the color band images.
Click any image to see it full size.
Red Filter | Green Filter | Blue Filter |
Red Band (Intensity) | Green Band (Intensity) | Blue Band (Intensity) |
Your task is to write the questions, under the same rules as before:
- A first-layer neuron sees only its own cells and reports filled/empty.
- A middle-layer neuron may poll only a specific list of cells and must return a single number.
- No neuron at any layer may name shapes, but shape information could be contained in a second middle layer.
Write five questions for your first middle layer. Then write three questions for a second middle layer that only hears the first.
Some things you will probably run into:
- The question is really the answer. “Is this Elmo’s hair?” isn’t a feature.
- The question needs an answer you don’t have yet. “Are the eyes far apart?” is a good question, but it assumes something already found the eyes. Which layer did that, and what did it ask?
- The question only works once. A question tuned to one person’s specific face tells you nothing about the next one.
- The feature isn’t in the grid. Some of what distinguishes two faces is simply gone at this resolution.
The point isn’t that these are unanswerable. Real systems answer them, with far more layers and far more resolution than we have. The point is we can’t write them down, and neither can the engineers.
For digits, a person can specify the features. For faces, nobody can. The network finds something during training, and what it finds is not written in any language a person can read.
So: we know these systems work often enough to be deployed. We cannot often say what they are looking at.
Two words on where this goes: Robert Williams and Porcha Woodruff were both arrested in Detroit after facial recognition systems misidentified them — Williams in 2020, Woodruff, seven months pregnant, in 2023. Neither knew a face system had flagged them until police were at the door. We’re not diving into the policing side yet — that’s coming in a later week alongside sound recognition and Flock camera networks — but hold onto the question underneath it: when a face system gets it wrong, who finds out, and how long does it take?
Focus for Week 2#
This week we add Tools to the Case Study. You will still complete the Data section — we’re building up, not moving on — but your evaluation this week focuses on the Tools parts. Data should now come more easily, and you can be briefer there than you were in Week 1.
What “meeting the standard” looks like this week#
Find a particular facial recognition tool/technology to research.
Your Tools section has four prompts. Analyze facial recognition as the tool. The postal system is your comparison case and you’ll need it for the fourth prompt, and you may use it anywhere else it helps.
The habit from Week 1 carries over unchanged: a specific claim with a source, not a general statement. For Tools, “specific” means naming a mechanism, a number, or a rule, that is, something that could be checked.
- Mechanism — what does the tool actually do? Describe the path from input to output in terms a classmate could follow. An image comes in; what is it turned into? What comes out the other end (a name, a ranked list, a score)? Your group should be able to say where the numbers in the middle came from.
- Weak: “The AI scans the face and identifies the person.”
- Provenance — who built it, on what, and who decided it was good enough? Name the builder where you can. More importantly, name what it was trained and tested on, and who set the bar for release. This is where Week 1 comes back: the benchmark is itself a dataset someone assembled.
- Weak: “It was trained on biased data.”
- Deployment — what is the output allowed to do? This is the prompt most groups will underweight and it’s the one that matters most. A tool doesn’t act. A system around it acts. What happens to the output when it leaves the model? Who receives it, what are they permitted to do with it, and what is the procedure when the system isn’t confident?
- Weak: “Police use facial recognition to find suspects.”
- Failure profile — rate, pattern, cost, and who absorbs it. How often is it wrong? Is it wrong evenly, or does the error concentrate on particular people? What does a single error cost? And who pays that cost — the operator, the institution, or the person in the image?
- Weak: “Facial recognition has a high error rate for people of color, which is unfair.”
Consider the comparison: do the same four for the postal system, in two or three sentences, and explain why two systems built on the same idea produce such different profiles.
The trap to avoid#
Do not treat “the technology is flawed” as your answer. The USPS handwriting reader launched at 30–40% accuracy, which is far worse than any facial recognition system discussed here, and the harm was a late envelope. What did it take to make a 30% system safe? A confidence threshold, a fallback path, and a staffed room in Salt Lake City catching everything below the line. Detroit had none of that.
Accuracy alone tells you almost nothing. What matters is what a system is permitted to do with an answer it isn’t sure about, and who bears the cost when it’s wrong. Detroit’s settlement didn’t improve the algorithm at all. It changed what police were allowed to do with the output.
If your Tools section would still be correct with the accuracy numbers deleted, you’ve analyzed the system. If deleting them empties the section, you’ve only analyzed the model.
Working through the materials#
Same as last week: divide the materials among yourselves and bring back what you found. Four threads again —
- How the tool actually works (3Blue1Brown, both chapters)
- A system that works well enough, and what “well enough” required (USPS)
- How the failures were discovered (Gender Shades)
- What the failures cost and what changed afterward (Detroit)
Thread 1 is the one nobody should skip entirely. If no one in your group watched Chapter 1, your Tools section will describe a black box rather than a mechanism.
Where your group disagrees, write the disagreement down. The Actionable Auditing reading is designed to produce disagreement.
Citations#
Cite all sources in APA format in the Research Resources section. Every factual claim in your Data and Tools sections should be traceable to something on that list.
Turning In#
When you have completed your Case Study, download the Word or PDF version of your tab and turn it in on D2L to the assignment Week 2 Case Study. It is a group assignment, so only one member of the group needs to turn it in.
Each of you also submits an Individual Effort & Metacognitive Report (~250 words) as a separate individual upload on D2L. Describe what you contributed, what you learned, and any AI used in your work.
Week 2’s Case Study and Individual Reports are due by Sunday, September 13th at 11:59pm.
Reminders#
Put your group’s names at the top of the page, and do not copy from or to other groups’ Case Studies.
Case Studies that do not meet the standard will be returned without credit, and your group will have one week from receiving it to revise and meet the standard.