Week 1 Case Study: Data Collection and The US Census
All of this material is also available on Google Docs (MSU login required)
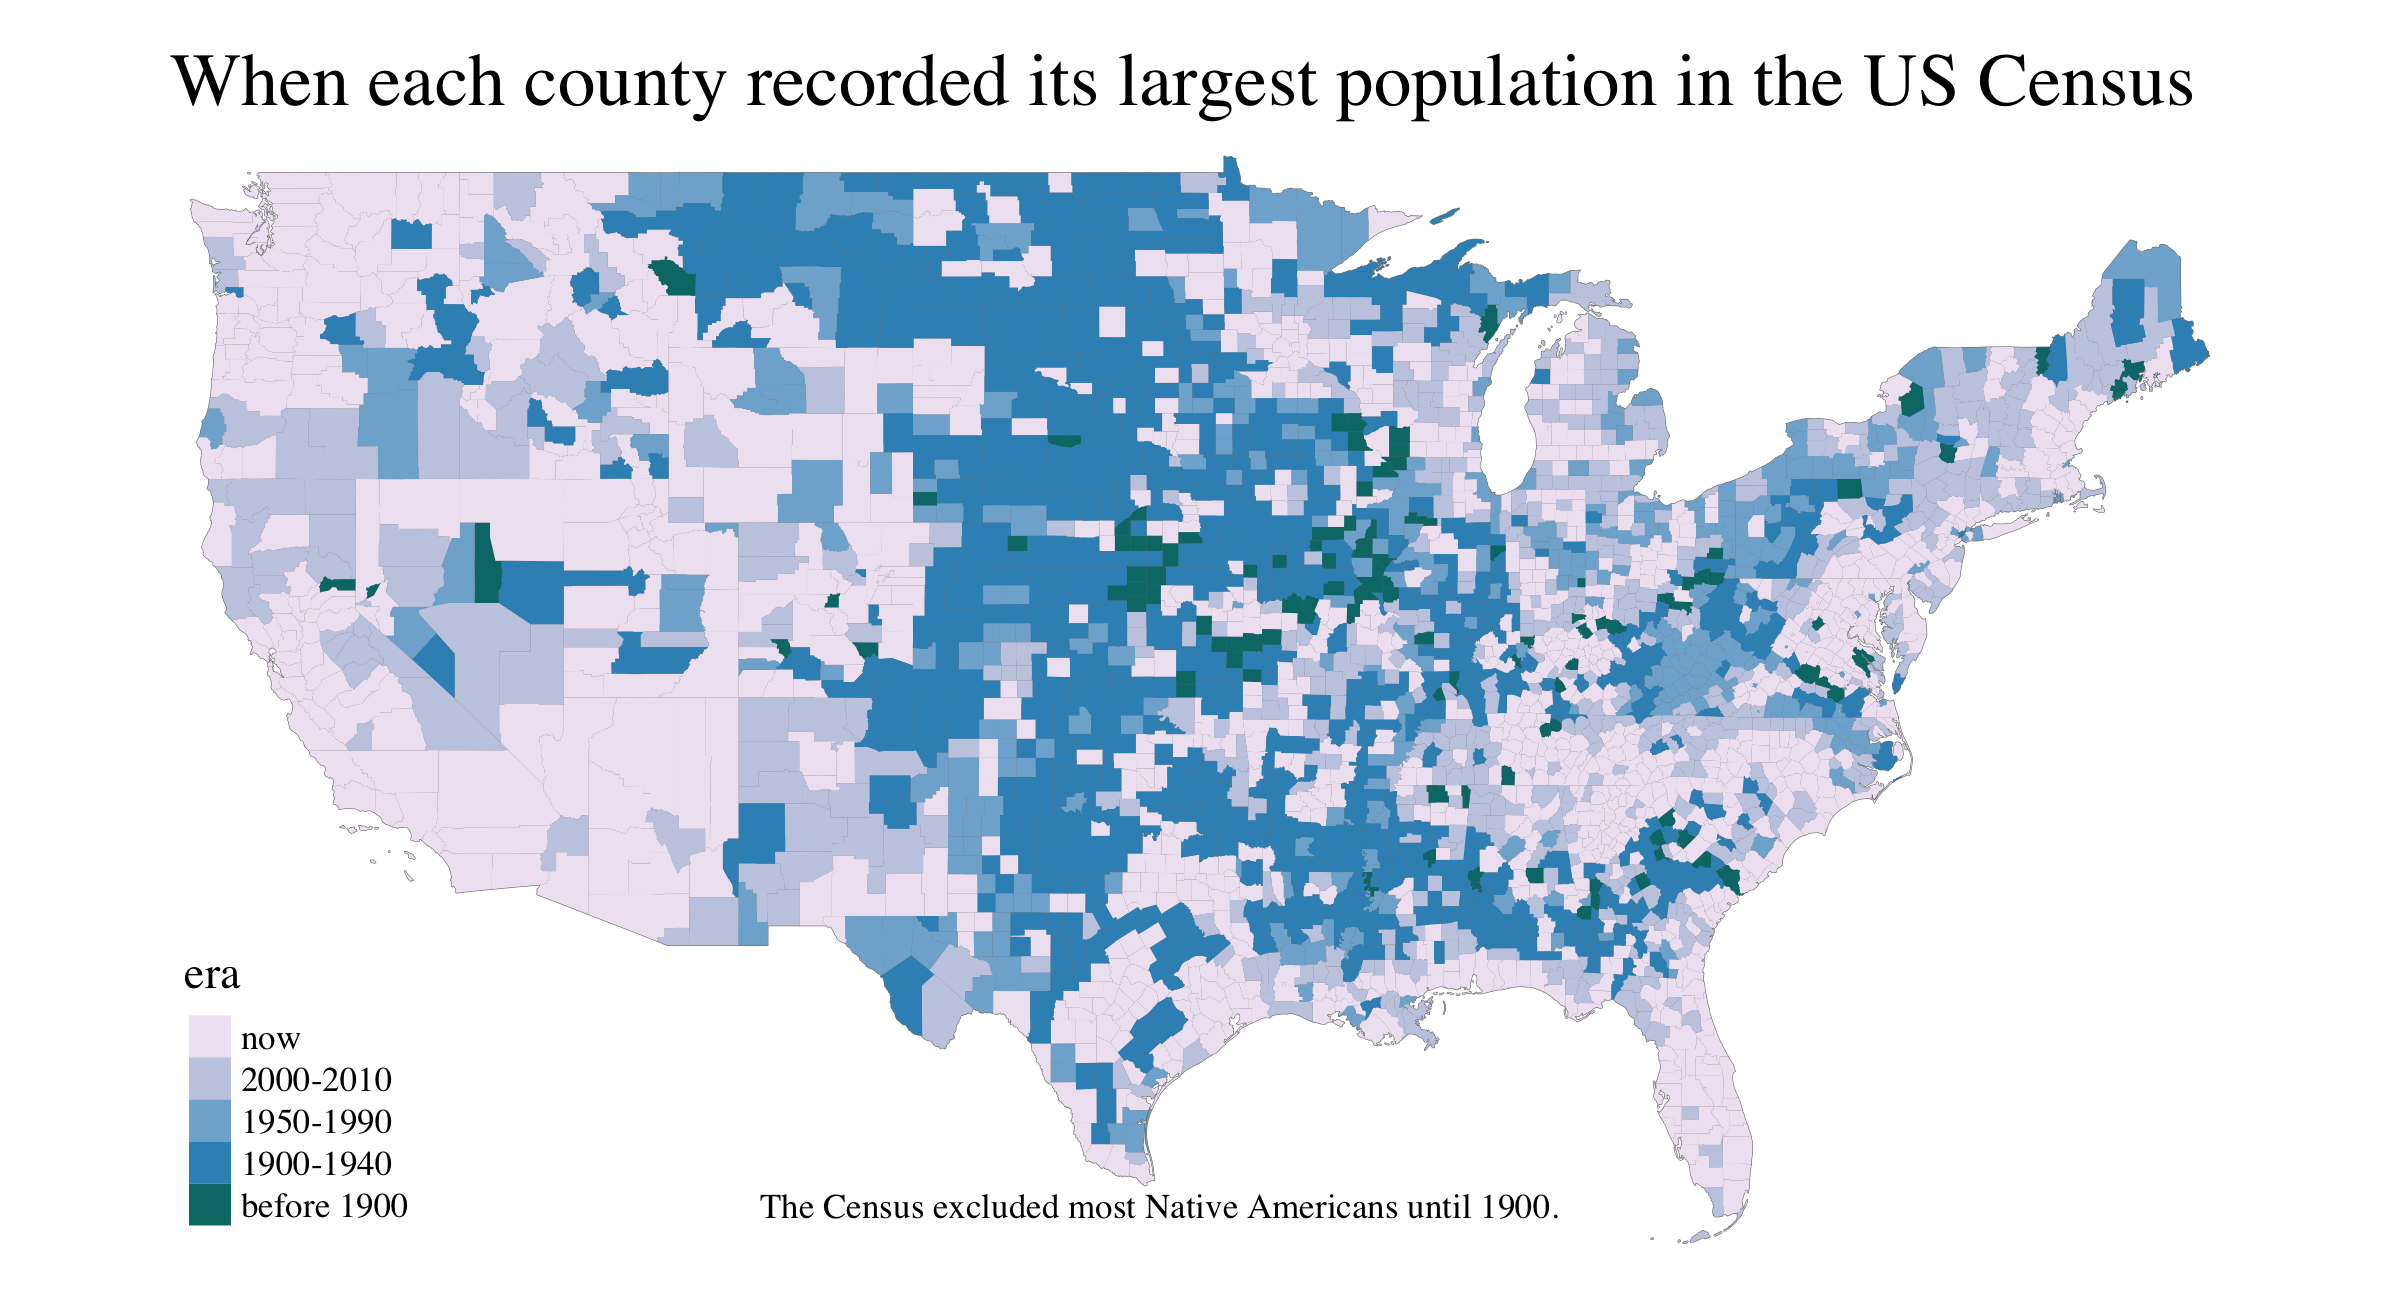
The U.S. Census of Population, 1790–today — and W.E.B. Du Bois’s data portraits of 1900.#
Every ten years the federal government asks every person in the country to sort themselves into a set of boxes. Those boxes decide how $1.5 trillion in annual federal funding is distributed and how many seats in Congress each state gets. The boxes have changed almost every decade since 1790. Someone chooses them.
In 1900, W.E.B. Du Bois and his students at Atlanta University took that same federal data and built roughly 60 hand-drawn charts for the Paris World’s Fair. By using the government’s own numbers, they argued nearly the opposite of what racial scientists of the era were arguing with them.
This is our starting case because it is the clearest possible example of the thing this whole course is about: data is not found, it is made. Before any AI system existed, people were deciding what to count, who fit where, and what happened to anyone who didn’t fit. Those decisions are still in the datasets that train today’s models.
Prep reading & resources (Complete by Friday, Sep 4)#
You do not individually have to review all materials. We expect that you will spend at least 90 minutes with these materials. Groups can discuss how to ensure all posted materials are reviewed each week.
Where the categories come from#
- 📖 What The Census Calls Us (Pew Research Center) — interactive timeline of every race/ethnicity category, 1790–2020. Watch for categories that appear and then vanish. Note that until 1950 the census taker decided your race for you, and that not until 2000 could you pick more than one.
- 📺 Why Does the Government Care About Race? (PBS Origins, 2019) — covers “mulatto” being added in 1850 at the request of racial scientist Josiah Nott, who hoped to use it to prove false theories about biological difference (9 min).
- 🎧 A Race To Know (Throughline, National Public Radio, April 2, 2020) — the census isn’t just a set of questions, it’s a statement. Some historians argue it helps form notions of racial hierarchy (40 min).
Who makes the data#
- 📖 W.E.B. Du Bois’ hand-drawn charts from 1900 show the story of Black Americans through data (USAFacts, 2021) — data and visualizations of these data collected by American sociologist W.E.B. Du Bois. He and his students at Atlanta University built roughly 60 hand-drawn charts for the 1900 Paris World’s Fair out of US Census and Bureau of Labor numbers. This was the same federal data others were using to argue the opposite conclusion. This is mostly pictures and quick to review.
- 📖 W.E.B. Du Bois’ Visionary Infographics Come Together for the First Time in Full Color (Mansky for Smithsonian Magazine, 2018) — the story of Du Bois’s data collection practices. “Du Bois’s charts” were made by a whole network of Black students, alumni, and field researchers across the South.
What a category hides#
- 📺 Hidden Barriers: Health Care’s Invisible Minority (Cascade PBS, 2021) — the aggregation problem made clear. Asian Americans are often perceived as wealthier, better educated, and healthier than other minority groups, but that preconception hides disparities that are in some cases worse than any other racial group’s. Watch for how a single “healthier than average” number gets built, and who it makes invisible (7 min).
- 📖 Income Inequality in the U.S. Is Rising Most Rapidly Among Asians (Pew Research Center, 2018) — this describes what a single checkbox can hide. In 2015, the share of adults with a bachelor’s degree inside the “Asian” category ran from 72% (Indian) down to 9% (Bhutanese), and median household income from $100,000 down to $36,000. Between 1970 and 2016 the group went from one of the most economically equal in the country to the most unequal. The category name stayed the same.
- 📖 Income inequality is greater among Chinese Americans than any other Asian origin group in the U.S. (Pew Research Center, 2024) — short follow-up showing the same aggregation problem, but one level down. After you split “Asian” into origin groups, the gaps observed inside those groups remain large.
- 📖 How data disaggregation matters for Asian Americans and Pacific Islanders (Washington Center for Equitable Growth, 2016) — collection of four charts that makes the structural version of the aggregation argument. Reporting one median income for a category containing 50+ ethnic groups doesn’t just simplify the picture, it actively conceals inequities that policy would otherwise have to address.
Who a category misses#
- 📖 Who is Hispanic? (Pew Research Center, 2024) — the Census Bureau treats “Hispanic” as an ethnicity, not a race, so it isn’t an option on the race question. In the 2022 ACS, 22.5 million Hispanics answered “some other race,” mostly by writing in a nationality. Meanwhile only 17% of Hispanic adults say being Hispanic is mainly about race; 42% say it’s mainly about culture.
- 🎧 Puerto Rico, Island Of Racial Harmony? (Code Switch, National Public Radio, April 24, 2020) — reporter Adrian Florido opens by asking his co-hosts to guess what share of Puerto Ricans identified as white alone on the 2000 census. Both guess low; the answer is 81%. The 2000 count was the first time the island got the race question at all. For the previous fifty years, Puerto Rico used a local form that didn’t ask the question (33 min).
- 📖 Shedding Light on Race Reporting Among Hispanics (United States Census Bureau, 2014) — the government’s own analysis of the same issue. More than 43% of Hispanics who self-reported their origin in 2010 did not fit into any federally recognized race group. The agency documented the mismatch and kept the form.
- 📖 Who Is ‘Some Other Race,’ the Second-Largest Racial Group in Massachusetts? (Shuster for Boston Indicators, 2022) — what happens to your answers after you submit them. If you check “White” and write in “Mexican,” the Bureau’s processing rules may record you as two races even though you selected one.
Focus for Week 1#
For this first week, we will focus on the Data part of the Case Study to make sure we develop a standard for what it means to analyze the Data concept. You are welcome to work on the other parts, of course, as you might need them to understand the Data concept. But your evaluation this week will focus only on the Data parts of your Case Study.
This is to help us develop a standard for a Case Study of Data and to give space to answer questions about performing a Case Study. In future weeks, we will add Tools, Practices, and Actions, eventually building up to full Case Studies.
What “meeting the standard” looks like this week#
Your Data section has four prompts. To meet the standard, each one needs a specific claim with a cited source behind it, not a general statement about bias. Some questions to push on:
- Collection: What was collected, by what method, and by whom? Was race self-reported or assigned by an enumerator? How did that change over time and why?
- Criteria: Who is included and who is excluded by the categories themselves? Name a specific group and a specific census year. Unpack or follow what happened.
- Manipulation / Encoding: What happens to a response after it is submitted? Look for editing, imputation, recoding, and back-end processing rules. You might need to do more research here.
- Bias & Inequity: Give a concrete downstream consequence. Who lost funding, representation, visibility, or safety because of how the data was structured? You might need to do more research here.
A strong answer sounds like: “In the 2010 census, more than 43% of self-reported Hispanics did not fit any federally recognized race group (U.S. Census Bureau, 2014).”
A weak answer sounds like: “The census has historically been biased.”
Working through the materials#
The posted materials are more than any one person should read. That is intentional. Divide them among yourselves, then bring what you found back to the group. The Case Study should reflect a conversation, not four separate summaries stapled together.
The materials fall into roughly four threads, which may be a useful way to split them:
- How the categories were chosen and changed (census history)
- Who made the data and whose labor goes uncredited (Du Bois)
- What averaging inside a category hides (Asian American disaggregation)
- What happens to people the categories don’t fit (Hispanic origin, “some other race”)
Where your group disagrees, write the disagreement down rather than resolving it away. Section 3 of the template asks for this specifically, and noting where you couldn’t agree is evidence of analysis, not a failure of it.
Citations#
Cite all sources in APA format in the Research Resources section. Keep a running bibliography as you go. You’ll only need to paste the final list in at the end. Every factual claim in your Data section should be traceable to something on that list.
Turning In#
When you have completed your Case Study, download the Word or PDF version of your tab. You will turn in that version on D2L to the assignment Week 1 Case Study. It is a group assignment, so only one member of the group needs to turn it in.
Each of you also submits an Individual Effort & Metacognitive Report (~250 words) as a separate individual upload on D2L. Describe what you contributed, what you learned, and any AI used in your work. This one is not optional and not shared; everyone writes their own.
Week 1’s Case Study and Individual Reports are due by Sunday, September 6th at 11:59pm. You may, of course, turn them in earlier.
Reminders#
Make sure to put your group’s names at the top of the page for your Case Study, and do not copy from or to other groups’ Case Studies. It’s important that your Case Study represents your group’s understanding and conversations, not those of others.
Case Studies that do not meet the standard will be returned without credit, and your group will have one week from receiving it to revise and meet the standard. Revision is expected and normal, especially in week one — this is a new format for everyone.
As we move forward, Case Studies will require more elements, so you might have to complete them as out-of-class homework assignments.